
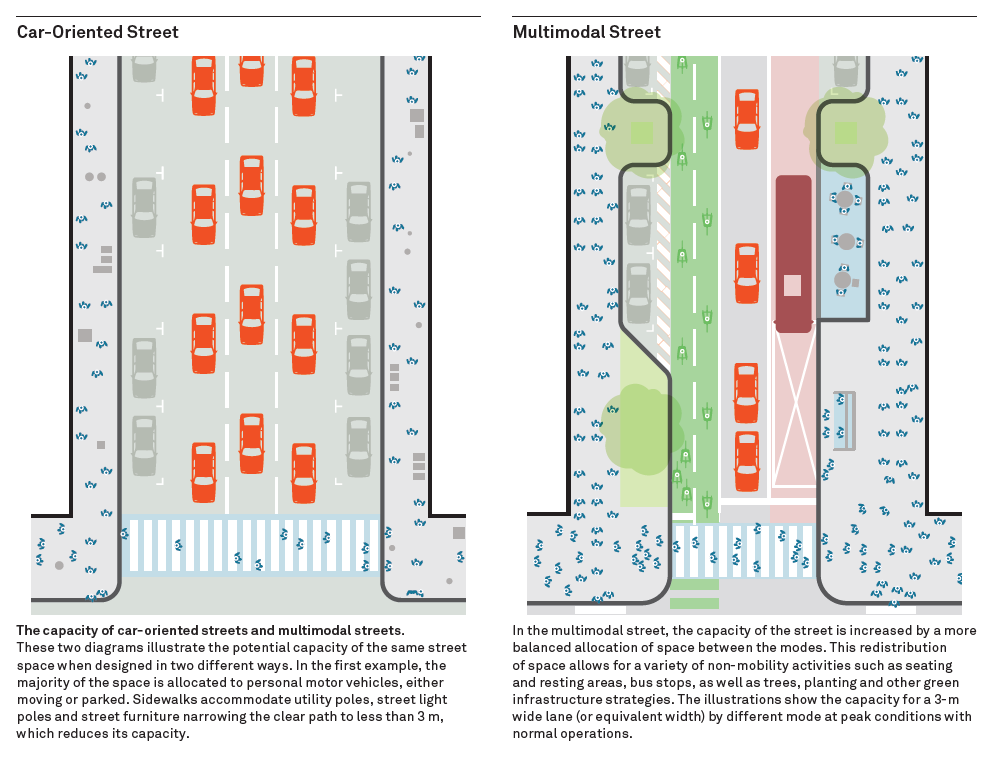
Overview
In the mid 20th century many urban streets were designed with excess automotive capacity in order to accommodate future peak hour traffic. Much of this traffic never materialized or dissipated due to suburbanization and other factors. Now, many cities are maintaining excessively wide streets which are under-used and which only offer a single transportation option for automobiles. These under-utilized traffic lanes are a valuable land bank and provide enormous opportunities to repurpose public space for more sustainable transportation uses.
Research and numerous case studies have shown that road diets (or, more recently known as lane repurposing) are one of the most effective traffic safety measures and provide opportunities to use under utilized right-of-way for pedestrian, cycling or transit facilities. Some road diets involve full reconstruction, but many can be built as re-striping projects at minimal costs. Preliminary analysis when considering a road diet should begin with reviewing daily traffic counts, crash analysis, assessment of adjacent land uses and referencing capacity limits of various roadway sizes listed below.
The importance of road diets cannot be overstated. They offer multiple benefits, including traffic calming, a reduction in crash rates across all modes, and opportunities to dedicate underutilized right of way to sustainable modes and human scaled public spaces.
Identifying the Problem
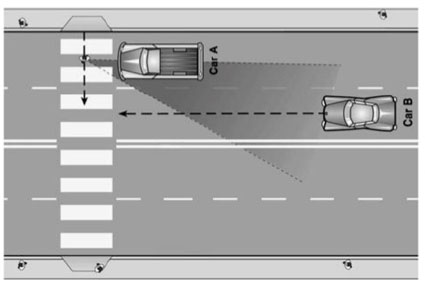
Roads with multiple lanes in each direction increase the crash risk for pedestrians and automobiles. Unsignalized pedestrian crossings on roads with 4 lanes or more poses a risk to pedestrians due to visibility issues. A pedestrian is not visible if they cross in front of one car while another approaches from the same direction. In this diagram, car A is stopped for the pedestrian while car B drives through the crosswalk.
Likewise, multiple lanes in each direction increases the number of possible collisions between vehicles. On 4 lane roads, the inner lanes often act as de facto turn lanes, increasing the likelihood of rear collisions due to cars slowing down or stopping when making a left. Left turning vehicles also have to cross multiple lanes of traffic, increasing the chances for a collision. Lane changing maneuvers then add another layer of risk for drivers.
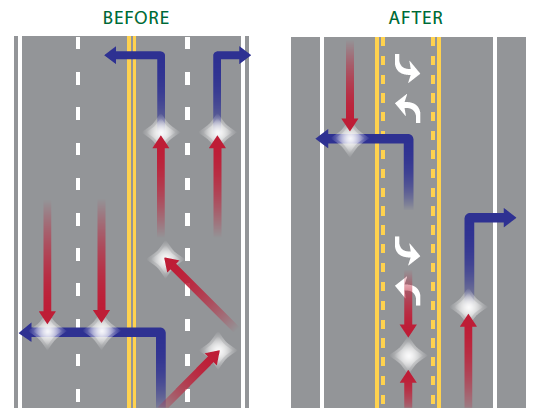
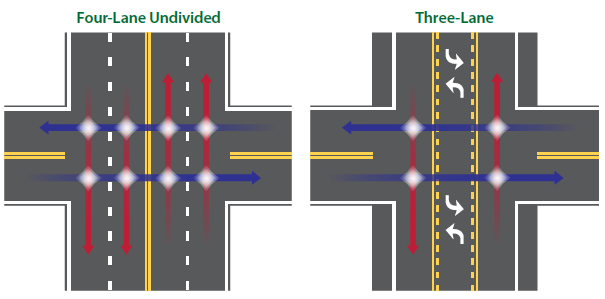
Multi-lane intersections have more possible conflict points than 2 or 3 lane roads. In a 3 lane configuration, the middle lane can act as a dedicated left turn bay at intersections, alleviating back pressure for turning vehicles and creating more predictable traffic movements.
Wider streets with more automotive traffic lanes tend to be more dangerous. Crash data analyzed for Dallas City arterial streets between 2011 and 2015 shows a positive correlation between crash rates across all modes and the number of traffic lanes. Wide arterial streets in urban areas can be prime candidates for road diets given their high speeds, high crash rates and diverse land uses which are conducive to allocating right of way to sustainable transportation modes.
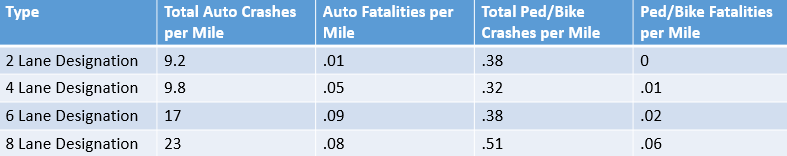
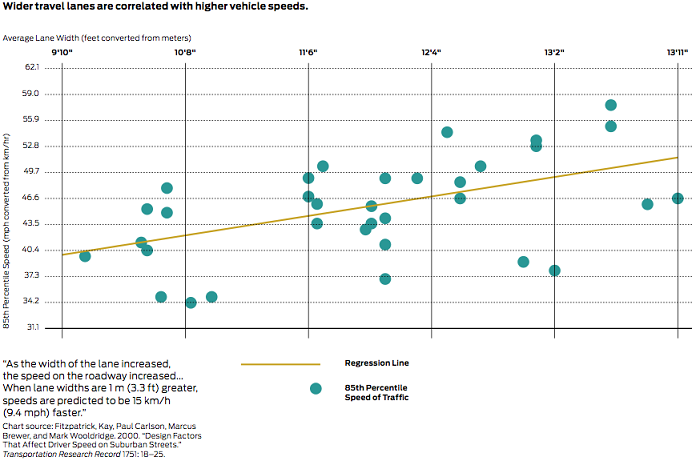
Every day observations also lead to the conclusion that wider streets encourage faster traffic speeds. Drivers behave differently on a 6 lane road versus a 2 lane neighborhood street. Research supports these observations and shows that pavement width greatly influences traffic speeds. In terms of improving traffic safety, slowing down traffic is one of the most effective ways to reduce fatalities and serious injuries on roadways.
Capacity
Capacity is a major concern for planners and engineers when considering road diets. This is the number of vehicles a roadway is able to accommodate while avoiding gridlock conditions. Daily capacities for various roadway types are listed below. (Round numbers based on Level of Service D/E thresholds in the Highway Capacity Manual)
- 2 lane local street: 1,000 vehicles per day based on livability
- 2 lane (w/ left turn lanes): 16,000 vehicles per day
- 4 lane (w/ left turn lanes): 31,000 vehicles per day
- 6 lane (w/ left turn lanes): 44,000 vehicles per day
- 4 lane freeway: 72,000 vehicles per day
- 6 lane freeway: 108,000 vehicles per day
- 8 lane freeway: 145,000 vehicles per day
The primary factor city planners and traffic engineers use in determining the feasibility of a road diet is average daily traffic. Municipalities and MPOs use varying traffic thresholds, but in general 4 lane roads under 25,000 vehicles per day are considered candidates for 3 lane conversion. In urban areas, some 6 lane roads even operate at 2 lane road capacities, so roads wider than 4 lanes can also be considered for road diets if they have low traffic volumes.
FHWA provides the following traffic volume guide for road diets on 4 lane roads.
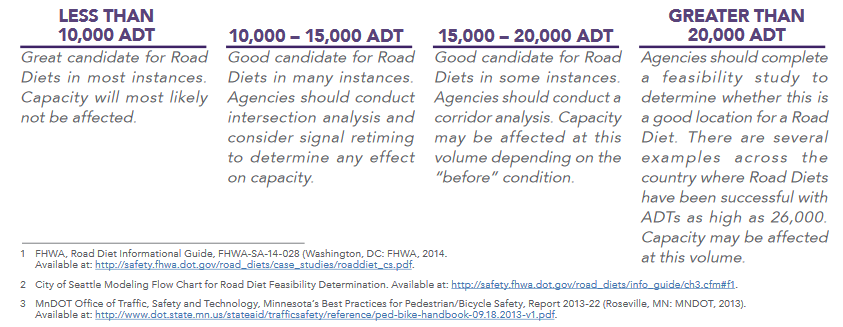
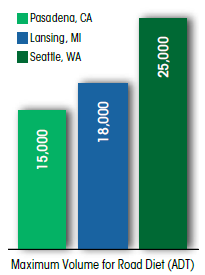
Cities use various traffic volume thresholds based on the chief engineer’s discretion, projected future traffic volumes, adjacent land uses and other factors.
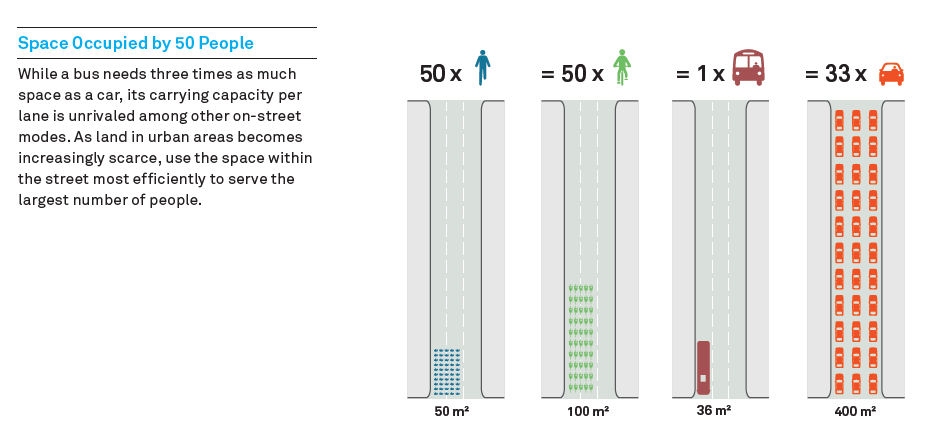
In terms of number of people moved per hour, lanes dedicated to private motor vehicles are the least efficient use of right of way. By converting underused auto lanes to bike lanes, bus lanes or pedestrian facilities, cities increase the total people capacity of a roadway while making it safer for all users.
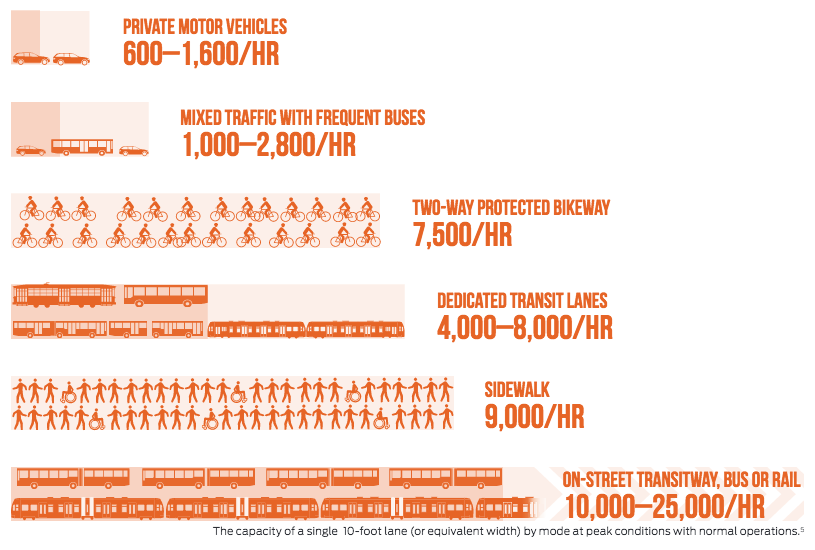
Automobiles are also the least efficient way to move people around based on physical space required for infrastructure.
Development and Future Traffic Volumes
Future traffic volumes should be considered for high-growth corridors when considering road diets. General traffic generation estimates from the ITE Trip Generation Report are included below. Keep in mind these are just estimates and trip samples are usually based on suburban land uses with no internal trip capture.
- Single Family Houses (per unit): 10 trips per day, 1 per peak hour
- Apartments/Condos/Townhouses (per unit): 6 trips per day, 0.6 per peak hour
- Office (per 1000 sq ft): 11 trips per day, 1.5 per peak hour
- Retail (per 1000 sq ft): 43 trips per day, 3.7 per peak hour
- Industrial (per 1000 sq ft): 7 trips per day, 1 per peak hour
Trip generation studies have recently been completed for mixed-use development projects. As more cities adopt smart growth land use policies and encourage mixed use development, new trip generation formulas will need to be used to estimate projected future traffic volumes for potential road diet projects. A more accurate assessment of future traffic conditions based on reduced automobile use will help justify the allocation of automobile capacity to other modes.
Many road diet projects saw a reduction in average daily traffic after construction. Induced demand, whereby increased supply creates an increase in demand, also works in reverse. Reducing roadway capacity for private vehicles has been shown to motivate drivers to take other routes or use alternate modes.
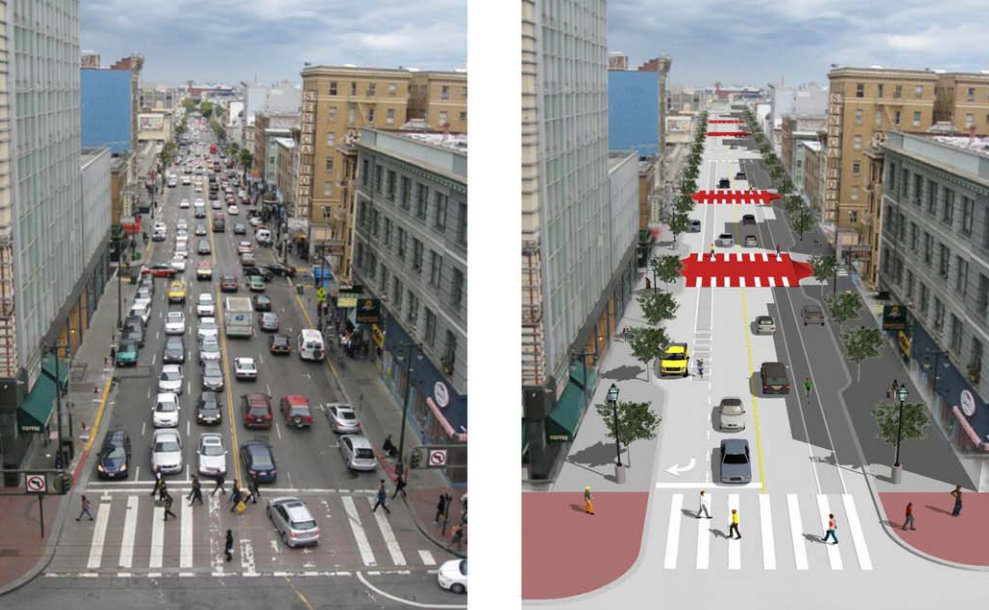
Types of Road Diets
Simple 4 to 3 lane road diet
Consolidating excessively wide lanes, adding a middle turn lane and maintaining on-street parking.
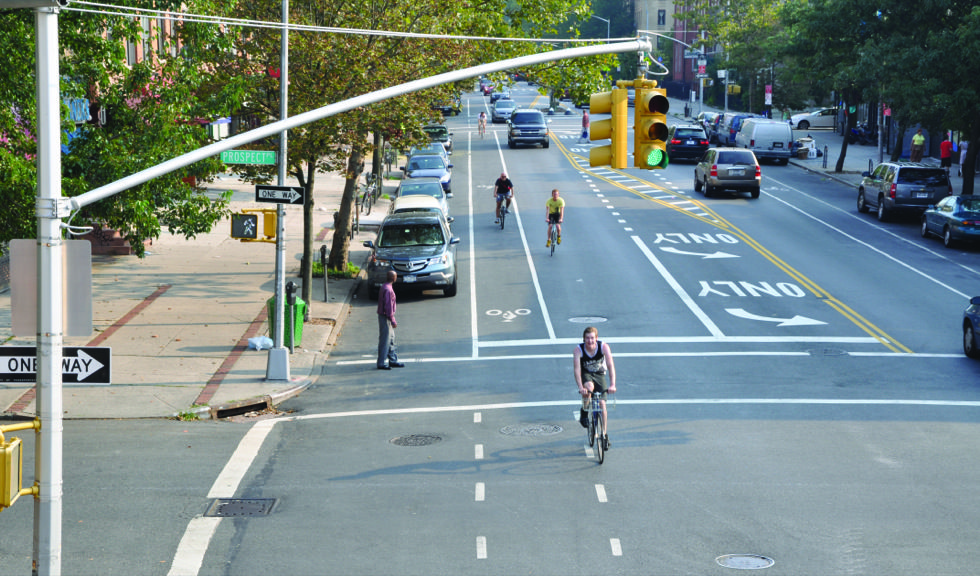
Bike Lanes
4 to 3 conversion with 5′ wide traditional bike lanes
Sidewalk Widening
When full reconstruction is possible, redundant automotive lanes can be re-purposed as pedestrian space.
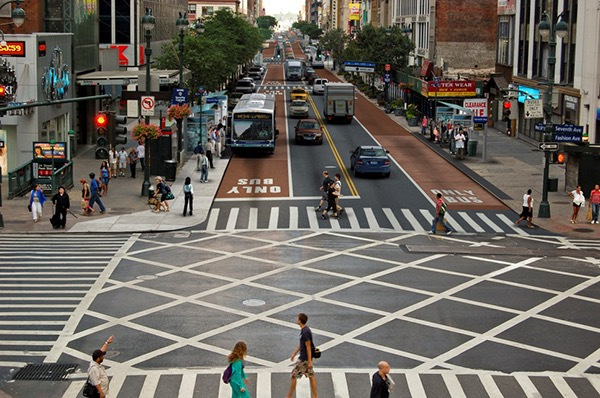
Bus Rapid Transit Lanes
Dedicated bus lanes are a good use of underutilized auto lanes
Jeff Speck Road Diet Video Examples
Jeff Speck: Four Road Diets from Cupola Media on Vimeo.
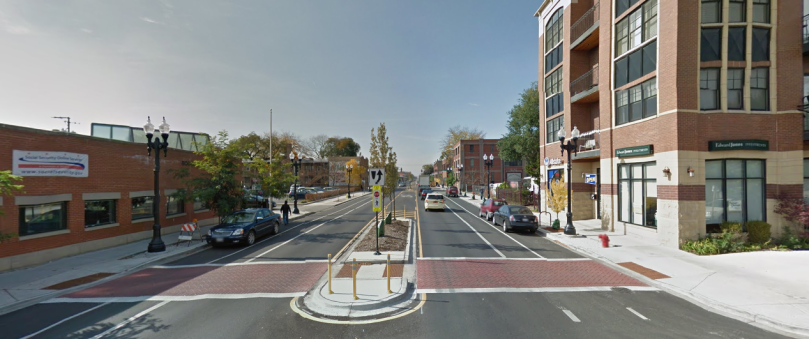
Pedestrian Refuge Islands
An overlooked benefit of road diets is the possibility for pedestrian refuge islands which have been shown to reduce pedestrian-related crashes by up to 46%. They also provide landscaping and storm water management opportunities. Islands can be located at intersections or high pedestrian volume mid-block locations.
Lane Diets
While not technically a road diet, reducing the width of traffic lanes slows down traffic and allows spare right of way to be allocated to other modes. Coordination with transit agencies when considering lane diets is recommended as buses usually require 11′ lanes. It’s not uncommon for urban streets which haven’t been resurfaced in awhile to be designed with 13′ or 14′ lanes. These streets provide an opportunity for low-cost re-striping improvements and possible sidewalk or bike facility additions.
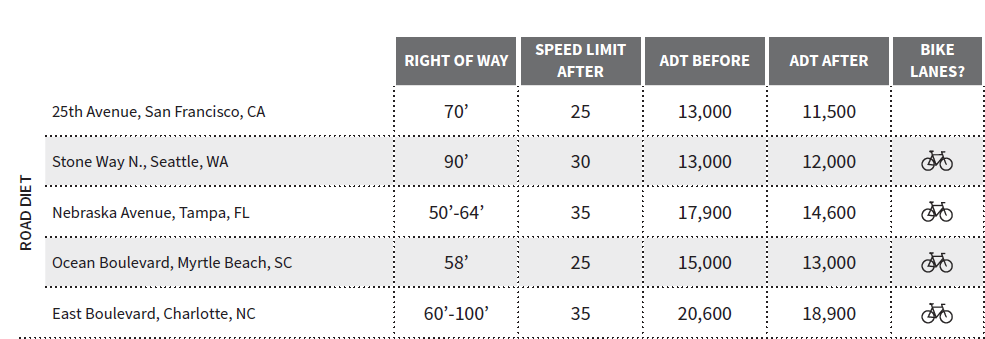
Road Diet Results (source: Rethinking Streets, University of Oregon)
- 25th Ave., San Francisco – Simple 4 to 3 lane road diet
- ADT went from 13,500 before construction to 11,000 after construction
-
Bus boardings increased by 35% along the stretch of 25th Avenue that was redesigned
- Stone Way N., Seattle, WA – 4 to 3 lane road diet with bike lanes
- ADT went from 13,000 before construction to 12,000 after construction
-
Total collisions have declined 14%
-
Pedestrian collisions at crossings were reduced 80%
- Nebraska Ave., Tampa FL – Simple 4 to 3 lane road diet
- ADT went from 17,900 before construction to 14,600 after construction
-
174 crashes per year on average before construction. 56 crashes after
- Ocean Blvd, Myrtle Beach – 5 to 4 lane road diet
-
Collisions along the corridor dropped 400% after the redesign
- Pedestrian crashes dramatically reduced
- Average speeds reduced from 35mph to about 15mph
-
Road Diets and Autonomous Vehicles
Autonomous Vehicles have the potential to alter the paradigm of traffic modeling and eventually reduce future capacity needs due to more efficient traffic flows. In the future, autonomous vehicles may be able to drive together in groups with gaps between vehicles of only a few inches. More efficient intersection movements and fewer crashes which lead to congestion may also reduce the need for private vehicle capacity. While traffic flow benefits will primarily accrue on freeways at first, narrower lane widths and fewer traffic lanes may eventually be possible on local streets due to autonomous technology even as America’s driving population continues to grow, making road diets even more important in the future.
VISSIM simulation analysis suggests capacity benefits are likely to occur only on freeways when the fleet mix is at least 75% autonomous and assuming performance is programmed at intermediate levels between conservative and aggressive. At that point, likely post 2035, the AV fleet mix is likely to achieve traffic flow benefits of 25-35%. Beyond that, when regulations, liability concerns and driver comfort allow much more aggressive car-following algorithms, vehicle delays may be reduced by 45% or more. (Effects of Next-Gen Vehicles on Highway Capacity)
Summary of Benefits
FHWA has compiled these quick talking points to help educate communities on the benefits of road diets.
- Crash reduction of 19 to 47 percent.
- Reduction of rear-end and left-turn crashes through the use of a center two-way left-turn lane (TWLTL).
- Reduced right-angle crashes as side street motorists must cross only three lanes of traffic instead of four.
- Reduced speed differential due to one lane of traffic in each direction.
- Encourages a more community-focused, “Complete Streets” environment.
- Fewer lanes for pedestrians to cross and an opportunity to install pedestrian refuge islands.
- The opportunity to install bicycle lanes within existing cross section.
- The opportunity to allocate the “leftover” roadway width for on-street parking, transit stops, or other functions.
- Simplifying road scanning and gap selection for motorists making left turns from side streets or the mainline
Resources
NACTO Urban Street Design Guide
TRB Weekly – Going on a Road Diet
New Mexico DOT Road Diet Guide
Kentucky Transportation Center – Guidelines for Road Diet Conversions